The most important skill for an investor is how to value a stock. But how do you find out which stock to buy and which one to pass on?
A great way to do this is by valuing stocks. Investors try to value stocks to help them better decide whether or not to purchase them. However, there’s no single way to do this.
There are several metrics you can calculate that’ll help you better value any given stock in the market, and that’s what we’ll be covering today, so keep reading!
Stocks are the important foundation of many individual investors' portfolios and are usually bought and sold on stock exchanges. A stock, or equity, is a financial instrument that reflects ownership of a portion of a company, and a share is the units of a stock. For example, if a corporation has 1,000,000 shares outstanding and an investor buys a stock certificate for 50,000 shares, the investor owns 5% of the corporation's stock.
Why Value a Stock?
Before we get into the basics of valuing a stock, you might be wondering why you need to value market stocks in the first place. The market value of a stock tells an investor whether it is currently affordable to buy. When applying trading methods, the value becomes even more significant. Valuing stocks can help investors avoid big financial losses and obtain market profits. Although some believe differently, a stock's intrinsic value is not always the same as its current market price.
The efficient market theory holds that a stock's market price is always equal to its intrinsic worth, according to passive investors. Passive investors believe that a stock's price accurately reflects its value because all available information has already been priced into it.
One of the key reasons why market value is significant is that it gives you a precise way of knowing what a stock is worth which eliminates ambiguity or confusion. Buyers and sellers can agree on a price that is higher or lower than market value.
The Price/Earnings (P/E) Ratio
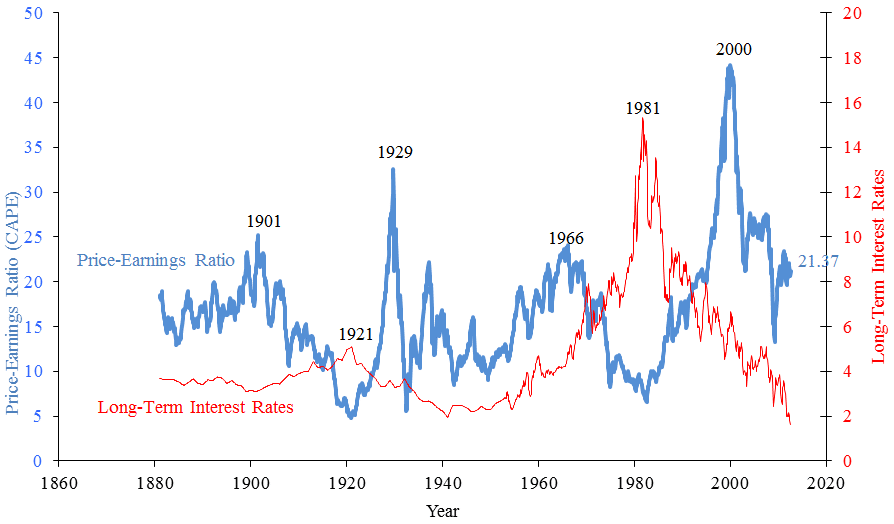
The calculation of the price/earnings ratio is straightforward. You just have to divide the current share price by the earnings per share. But for earnings per share, what number should be used? Should you use the total of the last 4 quarters, or should you use your projections for the coming year?

To answer the question above, there’s no one-size-fits-all answer. Since those earnings have already been booked, the P/E that is based on the previous 4 quarters gives you the best indication of the current valuation.
However, if you’re an investor, you most probably have an eye on estimates, which are publicly available on financial websites. You have to understand that the P/E cannot tell you if you should purchase or sell a stock. It's just a ratio for determining if a certain stock is undervalued or overvalued.
A $100 stock is not less expensive than a $200 stock if we assume they have the same total number of shares outstanding. Price is determined by how the stock is expected to perform in the future regarding valuation. If the earnings of the company with a higher price are expanding quicker than those of the company with a lower price, the former is not necessarily more expensive.
What Makes a P/E Ratio Good
Different stock types are valued differently. The market tends to reward significant profitability or growth. Consider the difference between a traditional conglomerate with a slow growth rate and small margins and a tech corporation that has bigger margins and a much more rapid growth rate. With a greater P/E, the market will usually favor the tech company.
Also, A P/E ratio that appeals to one investor might not appeal to another. Depending on whether their investing objectives are more firmly oriented toward value or growth, P/E ratios might be seen differently by various investors.
Value investors prefer low P/E ratios. They’re likely interested in a stock with a market valuation significantly lower than its intrinsic value. On the other hand, growth investors are more likely to be attracted to a stock with a high P/E ratio.
PEG Ratio
The PEG ratio can help you compare growth rates and P/Es – it is calculated by dividing the price/earnings (based on the current year’s earnings estimates) by the company’s long-term growth rate.
Generally speaking, you want to look for a stock whose PEG is around 1.0 or less, indicating that it’s trading at a similar rate to its growth rate. However, if you want to go for a high quality firm, you can spend extra.
Another thing to remember is that a very low P/E isn’t always a good sign; some firms will stay that way forever. Cyclicals – companies that perform based on the overall performance of the economy – are often penalized by the market.
Other Useful Valuation Metrics
You can use several metrics to accurately value a stock or a firm. Below are some of the most popular ones.
1. Price/Sales Ratio
The price/sales ratio is a popular metric for valuing stocks. Knowing how much you’re spending for revenue is as important as knowing how much you’re paying for earnings. Divide the price per stock by the sales per share for the last 12 months to get the Price/Sales ratio. It’s also possible to use estimates of the revenue for the coming financial year.
The P/S ratio is often used to evaluate public firms that don’t have earnings since they’re not yet profitable because it’s based on revenue rather than earnings. The P/S ratio isn’t often used to evaluate stalwart corporations with consistent earnings.
Since sales volumes vary so much from one business model to the other, you should only compare P/S ratios of firms with similar business models if you wish to compare P/S ratios of different firms.
2. Price/Book Value Ratio
The price/book ratio is a handy metric. A company's stock price is represented by price, and its book value per share is represented by the book.
Book value is the total assets − total liabilities and intangible assets of a corporation. After paying off all of your creditors, this is what the remaining assets of a company would be worth.
‘Shareholders' equity’ is the term used on each company’s balance sheet to represent book value. You can get a per-share book value by dividing the total by the number of shares outstanding.
The price/book ratio of a company can be used for evaluating firms with asset-light business models, such as tech corporations. It’s better suited for evaluating asset-heavy firms such as financial institutions (e.g. banks).
Don’t Fall Into the Value Trap
A ‘value trap’ can be defined as a stock that looks undervalued as it’s been trading at low valuation metrics for an extended period, such as P/E, P/CF, or P/B. It can attract bargain-hunting investors since it looks undervalued compared to the stock's industry peers, historical valuation multiples, or the current market multiple.
The threat of a value trap can be displayed when the stock continues to languish or fall after you buy into the firm. Remember, a stock may appear inexpensive, but due to poor business conditions, it’s not a profitable trade. A value trap is a stock that falls under this category.
Examples of value traps are a pharmaceutical company that has an important patent that is near its expiry, a cyclical stock right before it drops, or a tech business that made an initial breakthrough but is unable to innovate further.
The Bottom Line
Metrics can significantly help you value a stock. Still, no matter what metric you use, you should always examine a firm's qualitative characteristics and flaws when determining the stock's worth and value. Firms with defensible economic moats have an advantage over new market entrants, whereas companies with big user bases reap the benefits of network effects.
Firms with a relative cost advantage are more likely to be profitable, and those in areas with high switching costs can keep customers more readily.
